Dot-plotting with .NET Bio
One of the most common analysis done with genetic sequences is a dot-plot. This is where we plot two sequences against each other – in the X and Y direction to get a sense of the similarity between them. The dot-plot provides a simple, visual tool which can quickly identify consensus between the sequences. While it was originally developed for the genetic field, the actual concept can be applied to any style of data – allowing professors to detect plagiarism for example.
.NET Bio doesn’t provide any direct support for dot-plots, but it’s fairly easy to do. In this post, we will build a simple dot-plot program to compare two sequences (or a sequence against itself), and then we will enhance it with sliding windows to reduce the noise often produced due to the low number of symbols being compared (A/T/C/G).
To start with, we will use a WPF application – since I’d like to take advantage of the Model-View-ViewModel pattern, I am going to include my library of helpers but any MVVM helper library or routines would work here. You can get this from NuGet if you install the NuGet package manager into Visual Studio 2010.
We will also use .NET Bio, the open-source bioinformatics library I built with Microsoft Research. This library contains the core classes we will need to load, parse and interpret sequence data.
Introduction to Dot-Plots
The algorithm behind dot-plots is actually quite simple. We will take the first sequence of data and lay it down on the X axis of our graph. We will then take the second sequence and lay it along the Y-axis. Then, we fill in the actual plot by comparing each coordinate position. Where the X and Y are the same, we fill in that cell with a dot – where they are different we leave it blank. As an example, consider the following data:
**T G C C T G G C G G C C G T A G C G C G G T G G T C C C A C** **T x x x x x G x x x x x x x x x x x x C x x x x x x x x x x x ...**
When you compare the same sequence against itself you will see a diagonal line produced in the data where X == Y for each position.
In our program, once we load the two sequences, we will generate a byte array of matches. As a simplistic example, consider the following code which takes two sequences (_sequences[0] and _sequences[1]) and generates a byte[] of 0x00 and 0xff:
private void CalculateDataPlot()
{
    const byte ON = 0xff;
    const byte OFF = 0x00;

    long width = _sequences[0].Count;
    long height = _sequences[1].Count;

    _plotData = new byte[height,width];

    Parallel.For(0, height, row =>
    {
        for (long column = 0; column < width; column++)
        {
            _plotData[row,column] = _sequences[0][column] == _sequences[1][row] ? ON : OFF;
        }
    });

    OnPropertyChanged(() => PlotData);
}
We can then easily take this produced data and data bind it to an Image control in WPF using a ValueConverter to create a new BitmapSource:
public class ByteArrayToImageConverter : IValueConverter
{
    public object Convert(object value, Type targetType, object parameter,
               System.Globalization.CultureInfo culture)
    {
        byte[,] values = value as byte[,];
        int height = values.GetLength(0);
        int width = values.GetLength(1);

        byte[] buffer = new byte[height*width];

        int i = 0;
        for (int row = 0; row < height; row++)
        {
           for (int col = 0; col < width; col++)
           {
              buffer[i++] = values[row, col];
           }
       }
       return BitmapSource.Create(width, height, 96, 96,
                     PixelFormats.Gray8, null, buffer, width);
   }

    public object ConvertBack(object value, Type targetType,
            object parameter, System.Globalization.CultureInfo culture)
    {
       throw new NotImplementedException();
    }
}
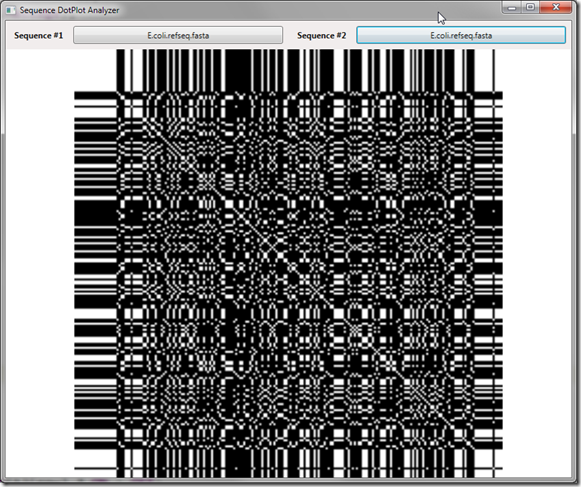
Loading a very simple sequence and comparing it against itself reveals the following image:

Notice the heavy amount of noise in the produced image? The problem is we have a ton of random matches – in fact we have a probability of a 1/4 (25%) match given an alphabet of 4 characters! This background noise is completely uninteresting in the data analysis, in fact it’s downright distracting to what we’d like to see. To remove/reduce this noise, what we need to do is apply a filter to the data by forcing the size of the window required to produce a dot to be larger than it’s current value (1).
We’ll do that next week – stay tuned!
Here’s the 1st draft of the code – Sequence Dot Plot Part 1