Debugging WPF with VS2010
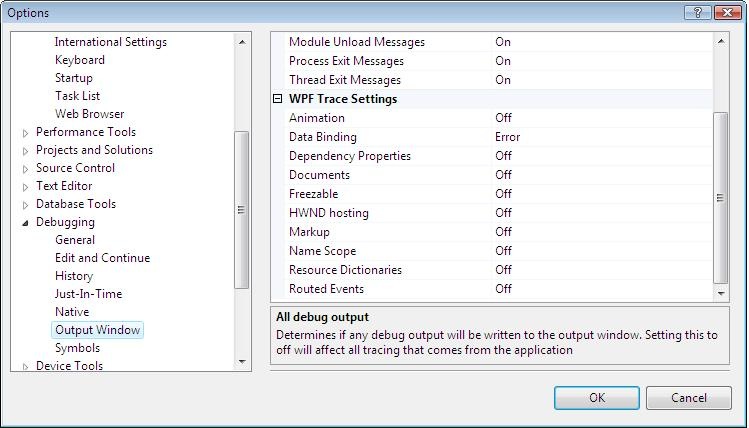
One of the coolest new debugging features included with VS2010 CTP1 is the management of WPF event traces directly in the IDE. With this feature you can turn specific event traces on and off and have them show up in the debug window. The default setting is to just show data binding errors - the existing behavior. But now you can view resource lookups, routed event creation, etc. Here’s the dialog:
